
This year my colleague Regina Payne and I tried something new as we visited classrooms across our district – numberless graphs. Similar to a numberless word problem, you present a graph with no numbers and proceed to have a rich mathematical discussion as you slowly reveal more and more information on the graph. Early in the school year, I shared a Halloween-themed numberless graph, and I also wrote a blog post about it.
We briefly touched on this work in our session at the 2017 NCTM annual conference, and it’s been exciting to see my #MTBoS colleagues taking the idea and running with it in their schools! In case you don’t follow them – which will hopefully change after reading this post! – I want to share their work so you don’t miss out on all the great stuff they’re doing.
Kassia Wedekind
Kassia has written two wonderful blog posts about how she took our ideas and tinkered with them to create a data routine called Notice and Wonder Graphs. I like this name because it’s more inclusive than numberless graphs. When it comes to graphs, you might hide the numbers, but you could just as easily hide other parts of the graph first. It all depends on your goals and how you want the conversation to unfold. In Kassia’s first post, she shares this graph with students. Notice it has numbers, and little else.

Curious what it’s about? Then check out Kassia’s post. I’m betting you’ll be quite surprised when you reach the final reveal.
I will share this snippet from her post:
I love this routine for many of the reasons that I love Brian’s numberless word problems–it slows the thinking down and focuses on sense-making rather than answer-getting.
But I also love it because it brings out the storytelling aspect of data. So often in school (especially elementary school!) we analyze fake data. Or, perhaps worse, we create the same “What is your favorite ice cream flavor?” graph year after year after year for no apparent purpose.
I’ve decided to make it a goal to think more about data as storytelling, data as a way to investigate the world, and data as a tool for action. In my next two posts (YES, people! I’m firing the ole blog back up again!) I’m going to delve into the idea that we can use data to discuss social justice ideas and critical literacy at the elementary level. I’m just dipping my toe into this waters, but I’m really excited about it!
And Kassia did just that! So far she’s followed up with one post where her students noticed and wondered about a graph showing the percent of drivers pulled over by police in 2011, by race. I love how the graph sparked a curiosity that got her students to dive more deeply into the data. How often does a graph about favorite desserts or our birthday months spark much of any curiosity?
Jenna Laib
Jenna shared a numberless graph that immediately got me curious! This is one she created to use with 6th grade students.

I can’t help but notice a bunch of dots grouped up at the beginning with a just few outliers streeetttcchhiiing across almost to the very end.

Once she included some numbers, my first instinct was that this graph is about ages. Apparently I wasn’t alone in that assumption!

And then there’s the final reveal.

So why did Jenna create and share this graph? What was her mathematical goal?

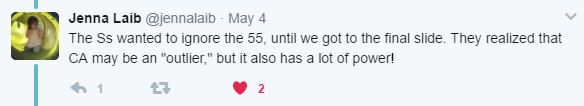
I especially loved this observation about how her students treated the dot at 55 before they had the full context about what the graph is really about.
Chase Orton
Chase wrote a detailed post about how he worked with 2nd grade teachers to do a lesson study about interpreting graphs.
…there’s so many rich opportunities for meaningful student discourse about data. That is, if it’s done right. Most textbooks suck all the life out of the content. Students need to understand that data tells a story; it has contextual meaning that is both cohesive and incomplete. Students need to learn how to ask questions about data and to learn to identify information gaps. In other words, students need to learn to be active mathematical agents rather than passive mathematical consumers.
Chase walks you through the lesson he and the teachers created and tried out in three different classrooms. I love how he details all of the steps and even shares the slides they used in case you want to use them in your own classroom.
He closes the post with a great list of noticings and wonderings about continuing this work going forward. Here are a couple of them about numberless graphs specifically:
- We need to give students more choice and voice about how they make meaning of problems and which problems they choose to solve. Numberless Data problems like these can be be a tool for that.
- The missing information in the graph created more engagement.
A huge thank you to Kassia, Jenna, and Chase for trying out numberless graphs and sharing their experiences so we can all be inspired and learn from them. I can’t wait to see how this work continues to grow and develop next school year!
If you’re interested in reading more first-hand accounts of teachers using numberless word problems and graphs, be sure to check out the ever-growing blog post collection on my Numberless Word Problems page. I recently added a post by Kristen Acosta that I really like. I’m especially intrigued by a graphic organizer she created to help students record their thinking at various points during the numberless problem. Check it out!
